[Back to Larry's Cascade Resource]
Please wait for the
charts to load
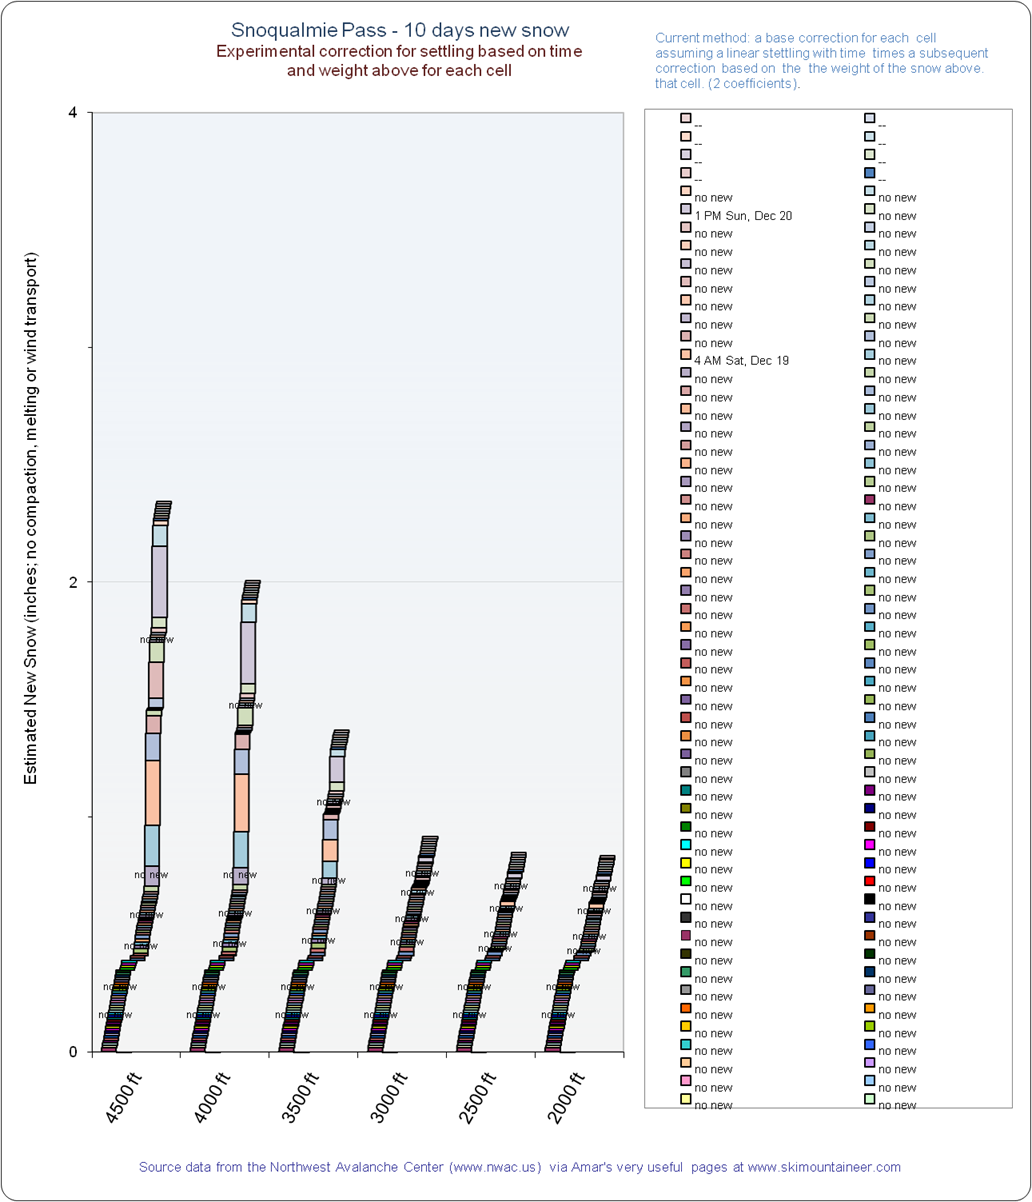
Chart 1: recent
additions to the snowpack by elevation
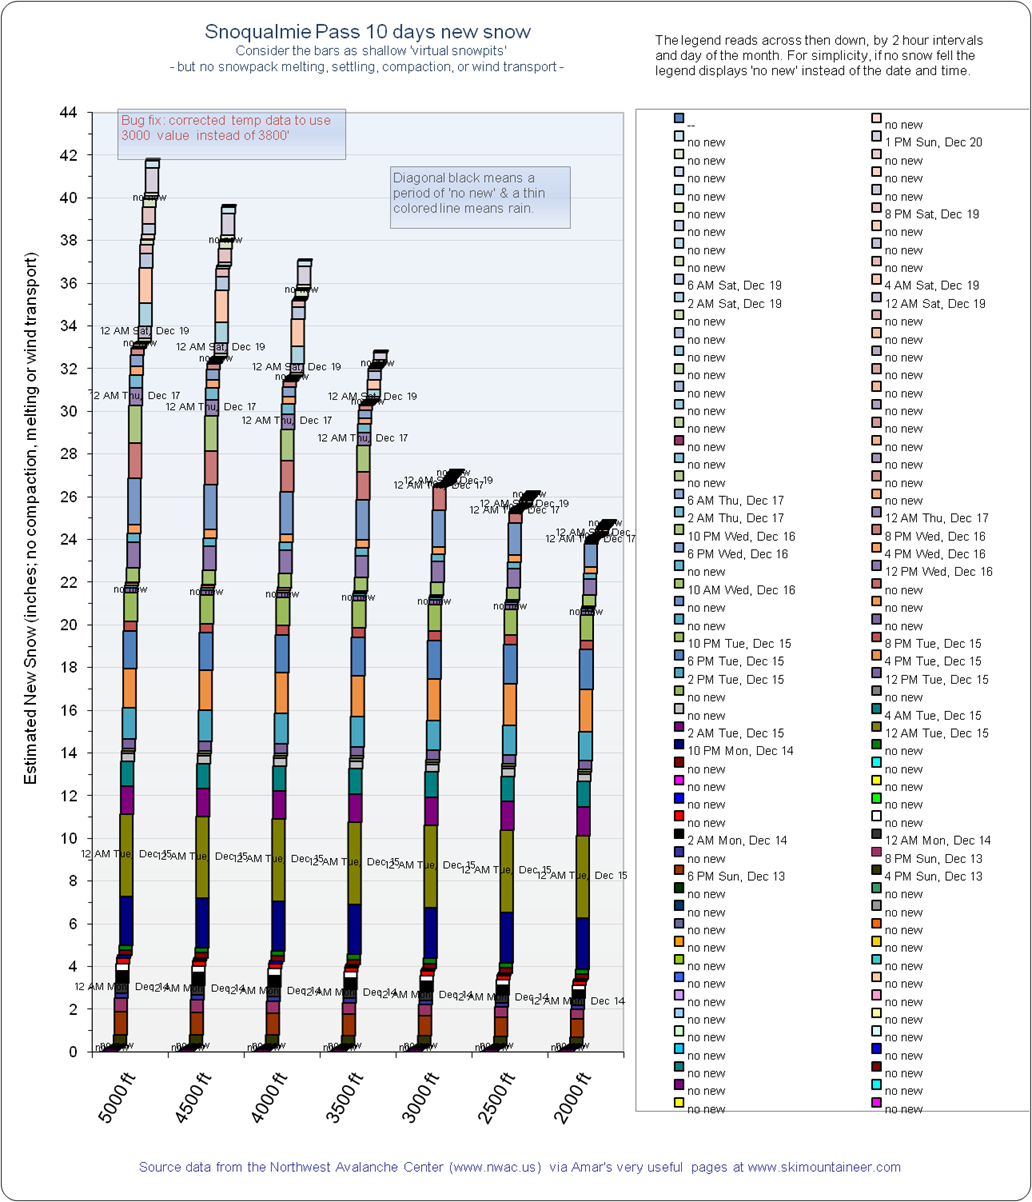
Chart 2: the rate
of accumulation of new snow
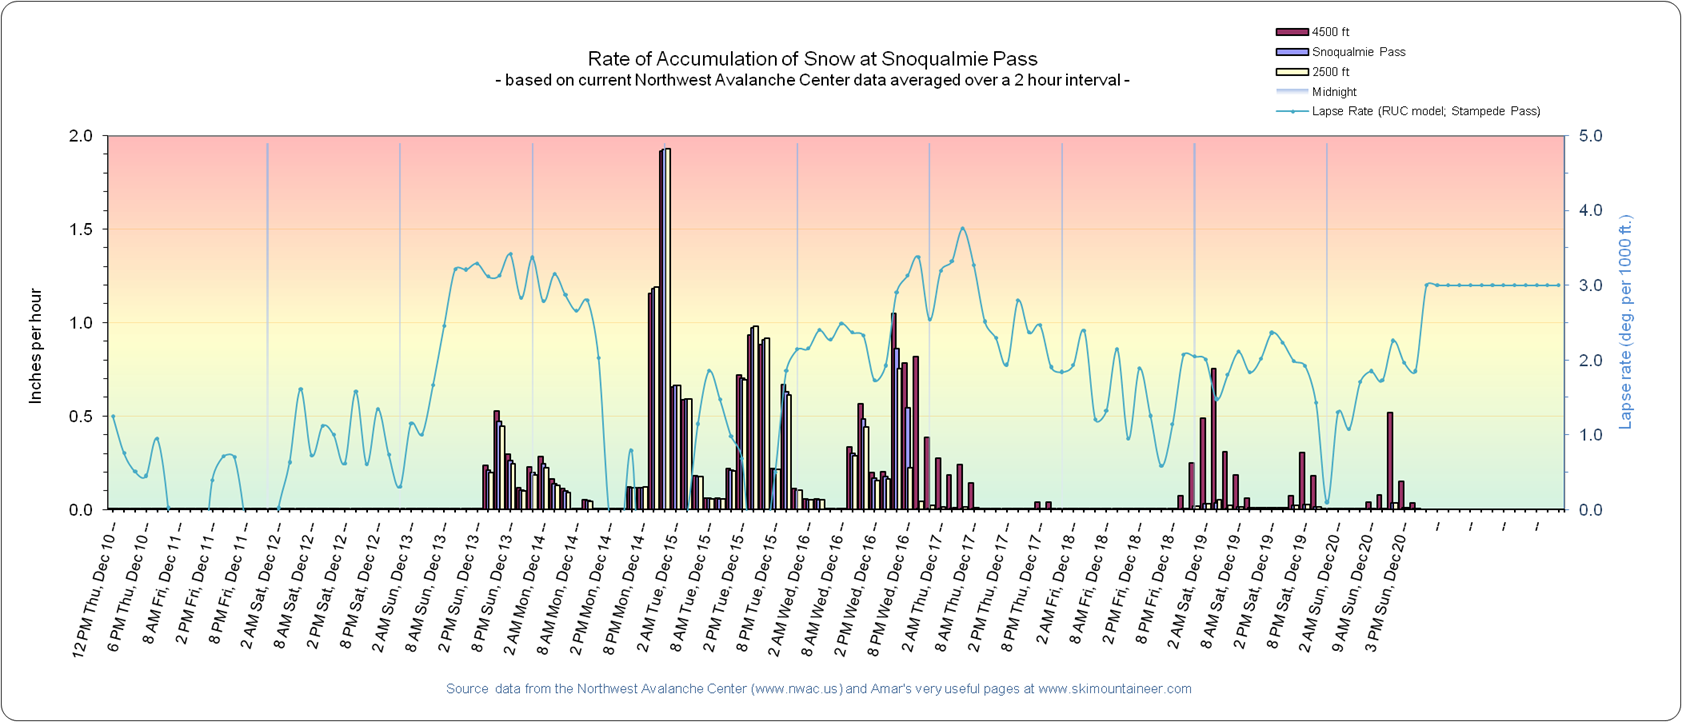
Chart 3: depicting
how much it snowed at 3 different elevations as well as the temperature at the
NWAC telemetry site
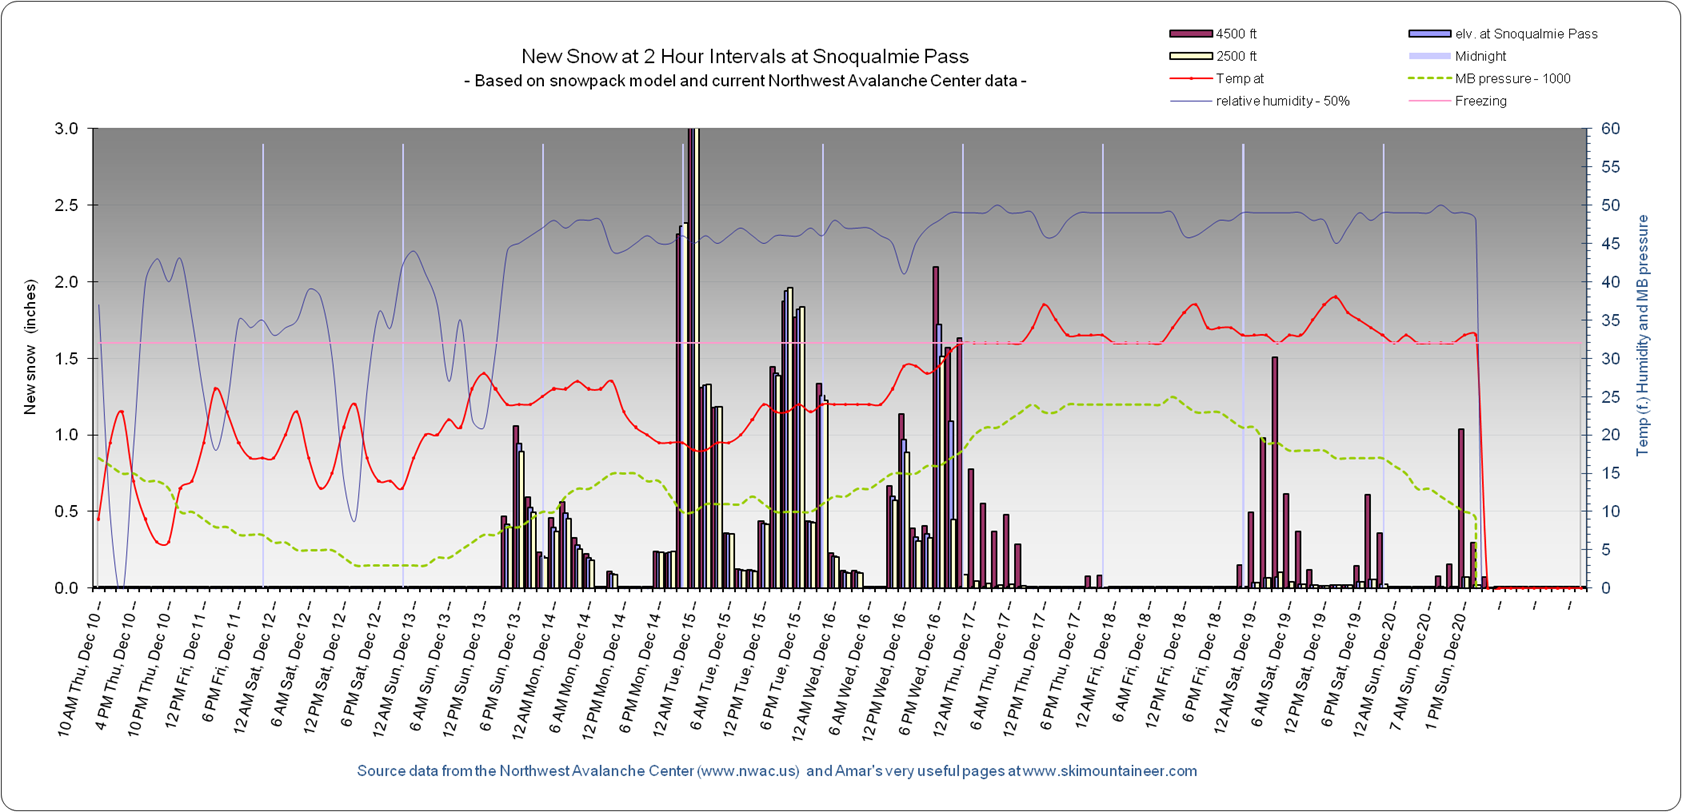
Chart 4: a
prediction of the spring snowpack
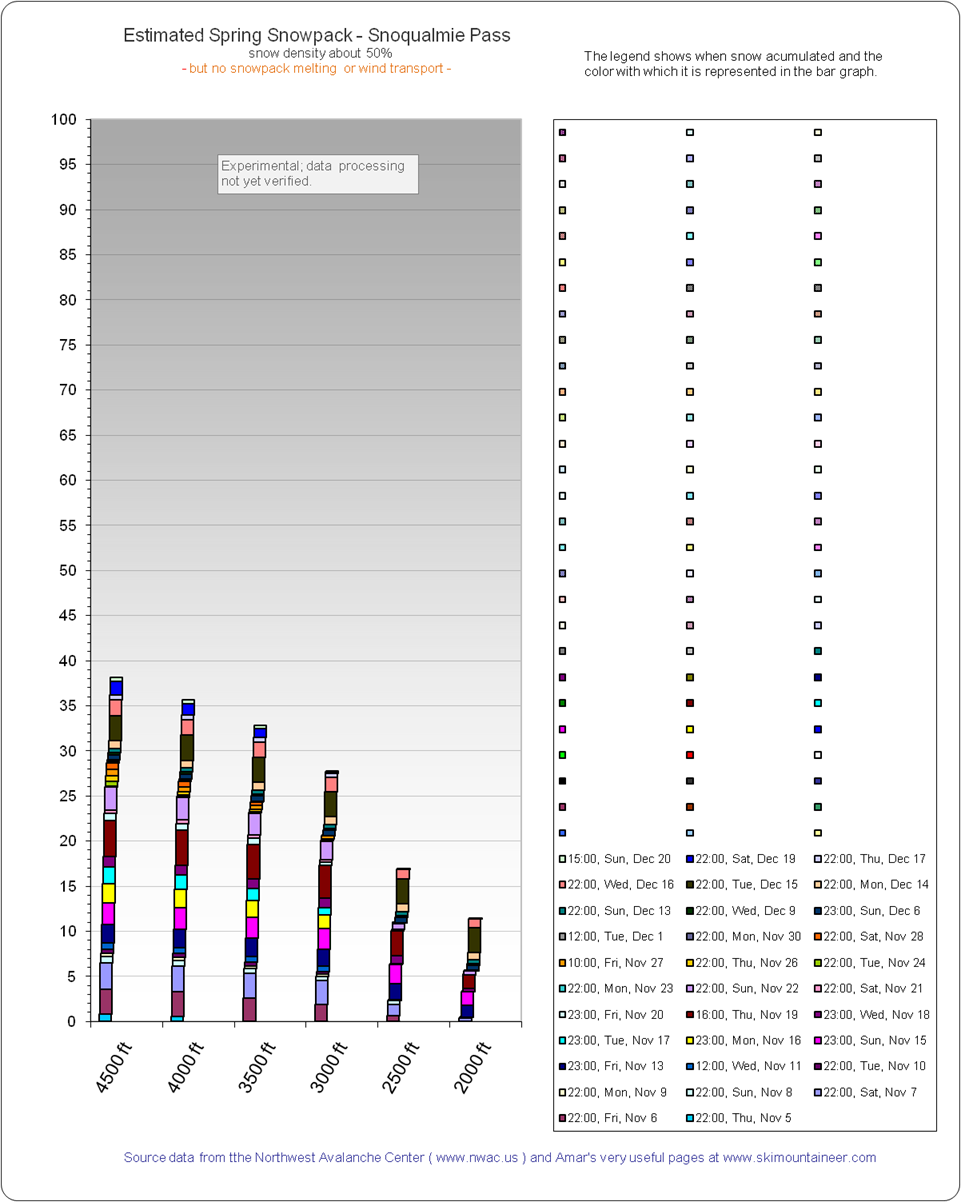
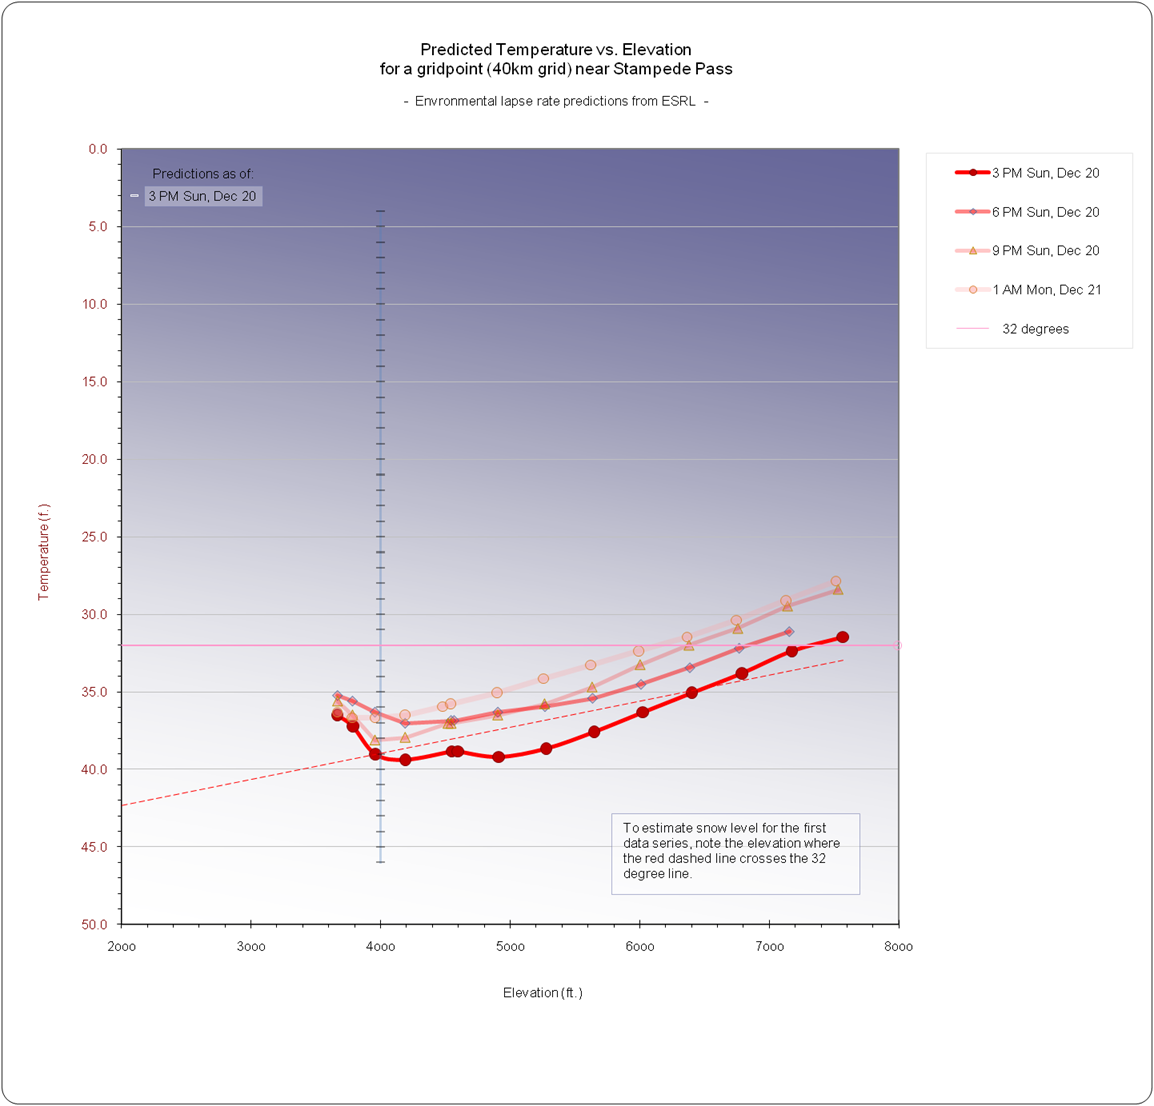
Chart 5: predicted
temperature changes with elevation for the following 12 hours
This chart has
rough adjustments for settling.